2010 UK local government election
 2010 local election results in Wakefield
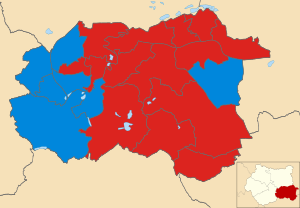
 The 2010 Wakefield Metropolitan District Council election took place on 6 May 2010 to elect members of Wakefield Metropolitan District Council in the West Yorkshire, England. One third of the council was up for election and the Labour party stayed in overall control of the council with an increased majority.
After the election, the composition of the council was as follows.
Party political make-up of Wakefield Council | | Party | Seats | Current Council (2010) |
| 2007 | 2008 | 2010 |
| | Labour | 40 | 32 | 33 | | | | | | | | | | | | | | | | | | | | | | | | | | | | | | | | | | | | | | | | | | | | | | | | | | | | | | | | | | |
| | Conservative | 16 | 23 | 24 | | | | | | | | | | | | | | | | | | | | | | | | | | | | | | | | | | | | | | | | | | | | | | | | | | | | | | | | | | |
| | Independent | 4 | 6 | 5 | | | | | | | | | | | | | | | | | | | | | | | | | | | | | | | | | | | | | | | | | | | | | | | | | | | | | | | | | | |
| | Lib Dems | 3 | 2 | 1 | | | | | | | | | | | | | | | | | | | | | | | | | | | | | | | | | | | | | | | | | | | | | | | | | | | | | | | | | | |
- Labour 33 (+1)
- Conservative 24 (+1)
- Independent 5 (-1)
- Liberal Democrat 1 (-1)[1]
Election result
Wakefield Local Election Result 2010 | Party | Seats | Gains | Losses | Net gain/loss | Seats % | Votes % | Votes | +/− |
| | Labour | 14 | 1 | 0 | +1 | 67 | 43.4 | 64,138 | +8% |
| | Conservative | 7 | 1 | 0 | +1 | 33 | 28.8 | 42,587 | -5% |
| | Liberal Democrats | 0 | 0 | 1 | -1 | 0 | 11.6 | 17,185 | +3% |
| | BNP | 0 | 0 | 0 | 0 | 0 | 9.0 | 13,247 | +1% |
| | Independent | 0 | 0 | 1 | -1 | 0 | 6.7 | 9,846 | -7% |
| | Green | 0 | 0 | 0 | 0 | 0 | 0.3 | 508 | -1% |
| | UKIP | 0 | 0 | 0 | 0 | 0 | 0.2 | 235 | ±0% |
| | Socialist Alternative | 0 | 0 | 0 | 0 | 0 | 0.1 | 159 | ±0% |
Ward results
Ackworth, North Elmsall and Upton ward
Ackworth, North Elmsall and Upton | Party | Candidate | Votes | % | ±% |
| | Labour | Allan Garbutt | 3,001 | 37.6 | -0.7 |
| | Conservative | Don Marshall | 2,434 | 30.5 | -12.7 |
| | Liberal Democrats | Brendan Power | 1,034 | 13.0 | -5.5 |
| | Independent | John Evans | 745 | 9.3 | +9.3 |
| | BNP | Ian Kitchen | 722 | 9.1 | +9.1 |
| Majority | 567 | 7.1 | +12 |
| Turnout | 7,973 | 63 | |
| | Labour hold | Swing | +6% | |
Airedale and Ferry Fryston ward
Airedale and Ferry Fryston | Party | Candidate | Votes | % | ±% |
| | Labour | Linda Broom | 3,305 | 55.7 | +9 |
| | Liberal Democrats | Paul Kirby | 1,009 | 17.0 | +2.7 |
| | Conservative | Mellisa Wan Omer | 715 | 12.1 | -5.9 |
| | BNP | Stephen Rogerson | 668 | 11.3 | -9.6 |
| | Independent | Jason Smart | 220 | 3.7 | +3.7 |
| Majority | 2,296 | 38.7 | +12.9 |
| Turnout | 5,930 | 51.6 | |
| | Labour hold | Swing | +3.2% | |
Altofts and Whitwood ward
Altofts and Whitwood | Party | Candidate | Votes | % | ±% |
| | Labour | Darran Travis | 3,385 | 46.2 | +8.8 |
| | Conservative | David Rudge | 1,561 | 21.3 | -1.2 |
| | Liberal Democrats | Michael Burch | 1533 | 20.9 | -2.6 |
| | BNP | Adam Frazer | 818 | 11.2 | -5.4 |
| Majority | 1,824 | 24.9 | +11 |
| Turnout | 7,327 | 59.7 | |
| | Labour hold | Swing | | |
Castleford Central and Glasshoughton ward
Castleford Central and Glasshoughton | Party | Candidate | Votes | % | ±% |
| | Labour | Denise Jeffery | 4,146 | 63.1 | |
| | Conservative | Eamonn Mullins | 1,209 | 18.4 | |
| | BNP | Rita Robinson | 1,147 | 17.5 | |
| Majority | 2,937 | 44.7 | |
| Turnout | 6,573 | 54.5 | |
| | Labour hold | Swing | | |
Crofton, Ryhill and Walton ward
Crofton, Ryhill and Walton | Party | Candidate | Votes | % | ±% |
| | Labour | Albert Manifield | 3,166 | 39.9 | |
| | Conservative | Ian Sanders | 2,305 | 29.0 | |
| | Liberal Democrats | Wendy Thompson | 1,262 | 15.9 | |
| | BNP | Dean Crossland | 846 | 10.6 | |
| | Independent | Barry Murphy | 345 | 4.3 | |
| Majority | 861 | 10.8 | |
| Turnout | 7,944 | 65.4 | |
| | Labour hold | Swing | | |
Featherstone ward
Featherstone | Party | Candidate | Votes | % | ±% |
| | Labour | Dick Taylor | 3,970 | 56.0 | |
| | Independent | Roy Bickerton | 1,466 | 20.7 | |
| | Conservative | Michael Ledgard | 923 | 13.0 | |
| | Independent | James Goodfellow | 668 | 9.4 | |
| Majority | 2,504 | 35.3 | |
| Turnout | 7,090 | 56.2 | |
| | Labour gain from Independent | Swing | | |
Hemsworth ward
Hemsworth | Party | Candidate | Votes | % | ±% |
| | Labour | Sandra Pickin | 3,630 | 54.7 | |
| | Independent | Raymond Warren | 1,341 | 20.2 | |
| | Conservative | Philip Davies | 942 | 14.2 | |
| | BNP | Ian Kitchen | 646 | 10.6 | |
| Majority | 2,289 | 34.5 | |
| Turnout | 6,633 | 56.6 | |
| | Labour hold | Swing | | |
Horbury and South Ossett ward
Horbury and South Ossett | Party | Candidate | Votes | % | ±% |
| | Conservative | Elizabeth Hick | 3,034 | 37.6 | |
| | Labour | Brian Holmes | 2,932 | 36.3 | |
| | Liberal Democrats | David Smith | 1,517 | 18.8 | |
| | BNP | Michael Bailey | 558 | 6.9 | |
| Majority | 102 | 1.3 | |
| Turnout | 8,070 | 67.1 | |
| | Conservative hold | Swing | | |
Knottingley ward
Knottingley | Party | Candidate | Votes | % | ±% |
| | Labour | Harry Ellis | 3,092 | 55.9 | |
| | Conservative | Jon Wadey | 1,379 | 24.9 | |
| | BNP | Norman Tate | 1,012 | 18.3 | |
| Majority | 1,713 | 31.0 | |
| Turnout | 5,528 | 52.2 | |
| | Labour hold | Swing | | |
Normanton ward
Normanton | Party | Candidate | Votes | % | ±% |
| | Labour | Elaine Blezard | 3,139 | 47.0 | |
| | Conservative | Jean Molloy | 1,370 | 20.5 | |
| | Independent | Graeme Milner | 1,231 | 18.4 | |
| | BNP | Philip Downton | 885 | 13.3 | |
| Majority | 1,769 | 26.5 | |
| Turnout | 6,674 | 53.6 | |
| | Labour hold | Swing | | |
Ossett ward
Ossett | Party | Candidate | Votes | % | ±% |
| | Conservative | Ian Bunney | 2,933 | 35.1 | |
| | Labour | Tony Richardson | 2,401 | 28.7 | |
| | Liberal Democrats | Peter Hunter | 2,327 | 27.8 | |
| | BNP | Ian Senior | 685 | 8.2 | |
| Majority | 532 | 6.4 | |
| Turnout | 8,368 | 66.2 | |
| | Conservative gain from Liberal Democrats | Swing | | |
Pontefract North ward
Pontefract North | Party | Candidate | Votes | % | ±% |
| | Labour | Clive Tennant | 3,051 | 45.6 | |
| | Conservative | Carl Milner | 1,594 | 23.8 | |
| | Liberal Democrats | Doug Dale | 1,008 | 15.1 | |
| | Independent | Bob Evison | 279 | 4.2 | |
| | Green | Rennie Smith | 150 | 2.2 | |
| Majority | 1,457 | 21.8 | |
| Turnout | 6,692 | 55.6 | |
| | Labour hold | Swing | | |
Pontefract South ward
Pontefract South | Party | Candidate | Votes | % | ±% |
| | Conservative | Geoff Walsh | 2,978 | 39.1 | |
| | Labour | Jack Kershaw | 2,773 | 36.4 | |
| | Liberal Democrats | Chris Rush | 1,333 | 17.5 | |
| | Independent | Matt Haddleton | 275 | 3.6 | |
| | Green | Neil Frankland | 150 | 2.2 | |
| Majority | 205 | 2.7 | |
| Turnout | 7,612 | 63 | |
| | Conservative hold | Swing | | |
South Elmsall and South Kirkby ward
South Elmsall and South Kirkby | Party | Candidate | Votes | % | ±% |
| | Labour | Laurie Harrison | 3,433 | 46.8 | |
| | Independent | Fred Hilton | 2,129 | 29.0 | |
| | BNP | Linda Westwood | 1,000 | 13.6 | |
| | Conservative | Christian IAnson | 734 | 10.0 | |
| Majority | 1,304 | 17.8 | |
| Turnout | 7,334 | 54.4 | |
| | Labour hold | Swing | | |
Stanley and Outwood East ward
Stanley and Outwood East | Party | Candidate | Votes | % | ±% |
| | Labour | Jacqui Williams | 2,936 | 37.5 | |
| | Conservative | Richard Wakefield | 2,578 | 32.9 | |
| | Liberal Democrats | David Evans | 1,539 | 19.6 | |
| | BNP | Keith Sharp | 761 | 9.7 | |
| Majority | 358 | 4.6 | |
| Turnout | 7,838 | 65.2 | |
| | Labour hold | Swing | | |
Wakefield East ward
Wakefield East | Party | Candidate | Votes | % | ±% |
| | Labour | Olivia Rowley | 3,109 | 49.5 | |
| | Conservative | Anthony Bracewell | 1,287 | 20.5 | |
| | BNP | Robert Arnold | 567 | 9.0 | |
| | Socialist Alternative | Michael Griffiths | 159 | 10.7 | |
| Majority | 1,822 | 29.0 | |
| Turnout | 6,284 | 53.5 | |
| | Labour hold | Swing | | |
Wakefield North ward
Wakefield North | Party | Candidate | Votes | % | ±% |
| | Labour | Tracey Hardwick | 2,703 | 42.2 | |
| | Conservative | Gareth Hunt | 1,904 | 29.7 | |
| | Liberal Democrats | Simon Moxon | 1,101 | 17.2 | |
| | BNP | Grant Rowe | 449 | 7.0 | |
| | UKIP | Keith Wells | 235 | 3.7 | |
| Majority | 799 | 12.5 | |
| Turnout | 6,412 | 57.4 | |
| | Labour hold | Swing | | |
Wakefield Rural ward
Wakefield Rural | Party | Candidate | Votes | % | ±% |
| | Conservative | June Drysdale | 4,107 | 44.6 | |
| | Labour | John Newsome | 2,859 | 31.1 | |
| | Liberal Democrats | Mark Goodair | 1,507 | 16.4 | |
| | BNP | Ian Light | 700 | 7.6 | |
| Majority | 1,248 | 13.6 | |
| Turnout | 9,203 | 69 | |
| | Conservative hold | Swing | | |
Wakefield South ward
Wakefield South | Party | Candidate | Votes | % | ±% |
| | Conservative | Nadeem Ahmed | 2,710 | 38.2 | -1.6 |
| | Labour | Charlie Keith | 1,703 | 24.0 | |
| | Independent | Norman Hazell | 1,147 | 16.2 | |
| | Liberal Democrats | Stephen Nuthall | 1,106 | 15.6 | |
| | BNP | Elizabeth Downton | 416 | 5.9 | |
| Majority | 1,007 | 14.2 | |
| Turnout | 7,097 | 66.6 | |
| | Conservative hold | Swing | | |
Wakefield West ward
Wakefield West | Party | Candidate | Votes | % | ±% |
| | Conservative | John Stone | 2,432 | 38.1 | |
| | Labour | Hilary Mitchell | 2,252 | 35.3 | |
| | Liberal Democrats | Susan Morgan | 909 | 14.3 | |
| | BNP | Neville Poynton | 559 | 8.8 | +0.3 |
| | Green | Brian Else | 208 | 3.8 | -0.5 |
| Majority | 180 | 2.8 | |
| Turnout | 6,378 | 56 | |
| | Conservative hold | Swing | | |
Wrenthorpe and Outwood West ward
Wrenthorpe and Outwood West | Party | Candidate | Votes | % | ±% |
| | Conservative | Betty Liles | 3,398 | 45.9 | |
| | Labour | Martyn Johnson | 3,152 | 42.5 | |
| | BNP | Graham Thewlis-Hardy | 808 | 10.9 | |
| Majority | 246 | 3.4 | |
| Turnout | 7,411 | 64.5 | |
| | Conservative hold | Swing | | |
References
- ^ "Local election results 2010". Archived from the original on 9 May 2011. Retrieved 7 July 2021.

 Council elections in West Yorkshire


