2013 Devon County Council election
|
|
All 62 seats to Devon County Council
32 seats needed for a majority |
|---|
| | First party | Second party | Third party | | | | | | | Party | Conservative | Liberal Democrats | Labour | | Last election | 41 seats, 41.9% | 14 seats, 29.9% | 4 seats, 6.1% | | Seats won | 38 | 9 | 7 | | Seat change |  3 3 | 4 |  1 1 | | Popular vote | 69,825 | 31,683 | 26,044 | | Percentage | 35.3% | 16.0% | 13.2% | | Swing | 6.6% | 13.9% | 7.1% |
| | | Fourth party | Fifth party | Sixth party | | | | | | | Party | UKIP | Independent | Green | | Last election | 0 seats, 9.0% | 2 seats, 4.6% | 1 seats, 6.8% | | Seats won | 4 | 3 | 1 | | Seat change | 4 |  | | | Popular vote | 45,550 | 11,148 | 12,785 | | Percentage | 23.0% | 5.6% | 6.5% | | Swing | 9.0% | 1.0% | 0.3% | |
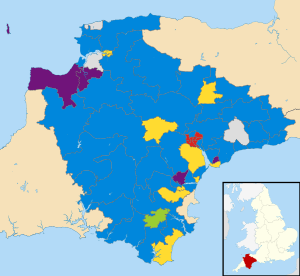 Map showing the results of the 2013 Devon County Council elections. |
Council control before election
Conservative
| Council control after election
Conservative
| |
An election to Devon County Council took place on 2 May 2013 as part of the 2013 United Kingdom local elections. 62 councillors were elected from electoral divisions which returned one county councillor each by first-past-the-post voting for a four-year term of office. The electoral divisions were the same as those used at the previous election in 2009. No elections were held in Plymouth and Torbay, which are unitary authorities outside the area covered by the County Council.
All locally registered electors (British, Irish, Commonwealth and European Union citizens) who were aged 18 or over on Thursday 2 May 2013 were entitled to vote in the local elections. Those who were temporarily away from their ordinary address (for example, away working, on holiday, in student accommodation or in hospital) were also entitled to vote in the local elections,[1] although those who had moved abroad and registered as overseas electors cannot vote in the local elections. It is possible to register to vote at more than one address (such as a university student who had a term-time address and lives at home during holidays) at the discretion of the local Electoral Register Office, but it remains an offence to vote more than once in the same local government election.[2]
Summary
The election saw the Conservative Party maintain overall control with a reduced majority of fourteen seats. The Liberal Democrats remained the council's largest single opposition party, while the Labour Party made a net gain of one seat. UKIP took its first seats on the council, winning four. The Green Party regained its seat (Totnes Rural) following an interim defection to the Labour Party. The election also saw three independent councillors elected.
Results
Devon County Council election, 2013[3][4] | Party | Seats | Gains | Losses | Net gain/loss | Seats % | Votes % | Votes | +/− |
| | Conservative | 38 | 2 | 5 | -3 | 61.3 | 35.3 | 69,825 | 6.6 |
| | Liberal Democrats | 9 | 2 | 6 | -4 | 14.5 | 16.0 | 31,683 | 13.9 |
| | Labour | 7 | 2 | 1 | +1 | 11.3 | 13.2 | 26,044 | 7.1 |
| | UKIP | 4 | 4 | 0 | +4 | 6.5 | 23.0 | 45,550 | 9.0 |
| | Independent | 3 | 1 | 0 | +1 | 4.8 | 5.6 | 11,148 | 1.0 |
| | Green | 1 | 1 | 0 | +1 | 1.6 | 6.5 | 12,785 | 0.3 |
| | Other parties | 0 | 0 | 0 | 0 | 0 | 0.2 | 447 | |
| | Liberal | 0 | 0 | 0 | 0 | 0 | 0.2 | 422 | 0.8 |
| | BNP | 0 | 0 | 0 | 0 | 0 | 0.0 | 28 | 0.5 |
Note: seat changes reflect the council composition immediately before the election, taking into account the defection of the Liberal Democrat councillor for Exwick & St Thomas to the Labour Party, and the June 2012 defection of the Green Party councillor for Totnes Rural to the Labour Party.
Election result by division
Alphington and Cowick
Alphington and Cowick[5] | Party | Candidate | Votes | % |
| | Labour | Roy Hill | 1,291 | 34.9 |
| | Liberal Democrats | Vanessa Newcombe | 976 | 26.4 |
| | UKIP | Dutch Dudgeon | 750 | 20.3 |
| | Conservative | Louis Ten-Holter | 499 | 13.5 |
| | Green | Diana Frances Moore | 175 | 4.7 |
| Majority | 315 | 8.5 |
| Turnout | 3,695 | 32.5 |
| | Labour gain from Liberal Democrats |
Ashburton and Buckfastleigh
Ashburton and Buckfastleigh[6] | Party | Candidate | Votes | % |
| | Conservative | Stuart Denis Barker | 1,314 | 36.6 |
| | UKIP | Alan Derek Whitton | 734 | 20.4 |
| | Green | Anna Clarke | 674 | 18.8 |
| | Labour | Michael Harriott | 451 | 12.6 |
| | Liberal Democrats | John Nutley | 408 | 11.4 |
| Majority | 580 | 16.2 |
| Turnout | 3,591 | 33.5 |
| | Conservative hold |
Axminster
Axminster[7] | Party | Candidate | Votes | % |
| | Conservative | Andrew T Moulding | 1,741 | 47.1 |
| | Independent | Paul G Hayward | 1,060 | 31.1 |
| | Liberal Democrats | Rob Jordan | 302 | 8.9 |
| | Labour | Jerry Walden | 219 | 6.4 |
| Majority | 740 | 21.7 |
| Turnout | 3,404 | 36.2 |
| | Conservative hold |
Barnstaple North
Barnstaple North[8] | Party | Candidate | Votes | % |
| | Liberal Democrats | Brian Carol Greenslade | 959 | 30.5 |
| | Conservative | Simon Peter Harvey | 672 | 21.4 |
| | UKIP | Michael Edward Pagram | 603 | 19.2 |
| | Green | Ricky Knight | 526 | 16.7 |
| | Labour | Mark Michael Robert Cann | 262 | 8.3 |
| | Independent | Tom Prideaux | 59 | 1.9 |
| | Communist | Gerrard Anthony Sables | 53 | 1.7 |
| Majority | 287 | 9.1 |
| Turnout | 3,143 | 28.9 |
| | Liberal Democrats hold |
Barnstaple South
Barnstaple South[9] | Party | Candidate | Votes | % |
| | Conservative | John Vincent Mathews | 955 | 31.6 |
| | Liberal Democrats | Chris Haywood | 824 | 27.3 |
| | UKIP | Christopher Frederick William Turner | 759 | 25.1 |
| | Labour | Geoff Moody | 285 | 9.4 |
| | Green | Rosemary Haworth-Booth | 184 | 6.1 |
| Majority | 131 | 4.3 |
| Turnout | 3,019 | 29.4 |
| | Conservative gain from Liberal Democrats |
Bickleigh and Wembury
Bickleigh and Wembury[10] | Party | Candidate | Votes | % |
| | Conservative | John Hart | 1,691 | 59.6 |
| | UKIP | Hugh Martyn Williams | 805 | 28.4 |
| | Liberal Democrats | Sue Bridgwater | 315 | 11.1 |
| Majority | 886 | 31.2 |
| Turnout | 2,838 | 29.7 |
| | Conservative hold |
Bideford East
Bideford East[11] | Party | Candidate | Votes | % |
| | UKIP | Gaston Amedee Dezart | 862 | 30.5 |
| | Conservative | Sam Robinson | 827 | 29.3 |
| | Labour | David George Brenton | 557 | 19.7 |
| | Liberal Democrats | Trevor John Johns | 393 | 13.9 |
| | Green | John Paul Hextall | 175 | 6.2 |
| Majority | 35 | 1.2 |
| Turnout | 2,824 | 26.9 |
| | UKIP gain from Conservative |
Bideford South and Hartland
Bideford South and Hartland[12] | Party | Candidate | Votes | % |
| | UKIP | Robin Julian | 944 | 31.0 |
| | Conservative | Alison Jane Boyle | 794 | 26.1 |
| | Independent | Adam James Symons | 774 | 25.4 |
| | Labour | Anne Brenton | 261 | 8.6 |
| | Liberal Democrats | Bob Wootton | 138 | 4.5 |
| | Green | Colin David Jones | 128 | 4.2 |
| Majority | 150 | 4.9 |
| Turnout | 3,045 | 31.4 |
| | UKIP gain from Conservative |
Bovey Tracey Rural
Bovey Tracey Rural[13] | Party | Candidate | Votes | % |
| | Conservative | George Gribble | 1,658 | 46.9 |
| | UKIP | Bruce Andrew Meechan | 781 | 22.1 |
| | Liberal Democrats | Sally Angela Morgan | 506 | 14.3 |
| | Labour | Lisa Collette Robillard Webb | 401 | 11.4 |
| | Green | Anna Murray Preece | 182 | 5.2 |
| Majority | 877 | 24.8 |
| Turnout | 3,532 | 39.4 |
| | Conservative hold |
Braunton Rural
Braunton Rural[14] | Party | Candidate | Votes | % |
| | Conservative | Caroline Jean Chugg | 1,073 | 36.1 |
| | UKIP | Stephen James Crowther | 742 | 24.9 |
| | Liberal Democrats | Elizabeth Mary Spear | 680 | 22.9 |
| | Labour | Valerie Jean Cann | 305 | 10.3 |
| | Green | Jooley Fowles-Smith | 165 | 5.5 |
| Majority | 331 | 11.1 |
| Turnout | 2,975 | 31.3 |
| | Conservative hold |
Broadclyst and Whimple
Broadclyst and Whimple[15] | Party | Candidate | Votes | % |
| | Conservative | Peter N Bowden | 1,159 | 36.3 |
| | UKIP | Sylvia M Brownlee | 691 | 21.6 |
| | Liberal Democrats | Derek G Button | 652 | 20.4 |
| | Green | Henry F Gent | 455 | 14.2 |
| | Labour | Gillian Nicholls | 235 | 7.4 |
| Majority | 468 | 14.6 |
| Turnout | 3,195 | 34.6 |
| | Conservative hold |
Budleigh
Budleigh[16] | Party | Candidate | Votes | % |
| | Conservative | Christine Channon | 1,373 | 42.2 |
| | UKIP | Graham A Hooker | 939 | 28.8 |
| | Liberal Democrats | Lesley Miszewska | 425 | 13.1 |
| | Green | Roger P Saunders | 291 | 8.9 |
| | Labour | Tony Badcott | 221 | 6.8 |
| Majority | 434 | 13.3 |
| Turnout | 3,255 | 37.4 |
| | Conservative hold |
Chudleigh Rural
Chudleigh Rural[17] | Party | Candidate | Votes | % |
| | Conservative | Jerry Brook | 1,153 | 34.7 |
| | UKIP | Geoffrey Raymond Trezise | 808 | 24.3 |
| | Independent | Stephen John Kinross Purser | 509 | 15.3 |
| | Liberal Democrats | Stephen Barnes | 308 | 9.3 |
| | Green | Patricia Langman | 273 | 8.2 |
| | Labour | Chris Raybould-Gooding | 266 | 8.0 |
| Majority | 345 | 10.4 |
| Turnout | 3,325 | 33.7 |
| | Conservative hold |
Chulmleigh and Swimbridge
Chulmleigh and Swimbridge[18] | Party | Candidate | Votes | % |
| | Conservative | Richard Colin Edgell | 1,482 | 42.3 |
| | Liberal Democrats | David John Worden | 846 | 24.1 |
| | UKIP | John Baglow | 731 | 20.8 |
| | Green | Mark Haworth-Booth | 228 | 6.5 |
| | Labour | Marion Elizabeth Mason | 212 | 6.0 |
| Majority | 636 | 18.1 |
| Turnout | 3,507 | 36.9 |
| | Conservative hold |
Combe Martin Rural
Combe Martin Rural[19] | Party | Candidate | Votes | % |
| | Conservative | Andrea Vivienne Davis | 1,452 | 52.6 |
| | UKIP | Andy Norden | 718 | 26.0 |
| | Liberal Democrats | Rodney Hillman Hawes | 274 | 9.9 |
| | Green | Scott Lawley Burrows | 174 | 6.3 |
| | Labour | Heathcliffe Guy Pettifer | 138 | 5.0 |
| Majority | 734 | 26.6 |
| Turnout | 2,762 | 33.3 |
| | Conservative hold |
Crediton Rural
Crediton Rural[20] | Party | Candidate | Votes | % |
| | Liberal Democrats | Nick Way | 1,367 | 35.7 |
| | Conservative | Derek Roy Coren | 1,336 | 34.9 |
| | UKIP | Mike Szabo | 656 | 17.1 |
| | Labour | Lynne Richards | 457 | 11.9 |
| Majority | 31 | 0.8 |
| Turnout | 3,828 | 38.4 |
| | Liberal Democrats hold |
Cullompton Rural
Cullompton Rural[21] | Party | Candidate | Votes | % |
| | Conservative | John Berry | 1,422 | 44.7 |
| | UKIP | Lloyd Knight | 653 | 20.5 |
| | Liberal | Jenny Roach | 422 | 13.3 |
| | Liberal Democrats | Luke Daniel Taylor | 315 | 9.9 |
| | Labour | Paul Jason Stone | 241 | 7.6 |
| | Green | Colin Matthews | 118 | 3.7 |
| Majority | 769 | 24.2 |
| Turnout | 3,180 | 30.2 |
| | Conservative hold |
Dartmouth and Kingswear
Dartmouth and Kingswear[22] | Party | Candidate | Votes | % |
| | Conservative | Jonathan Hawkins | 1,170 | 46.4 |
| | Labour | Ben Cooper | 675 | 26.8 |
| | UKIP | Martyn Brian Cocks | 507 | 20.1 |
| | Liberal Democrats | Janice Claire Henshall | 163 | 6.5 |
| Majority | 495 | 19.6 |
| Turnout | 2,522 | 35.6 |
| | Conservative hold |
Dawlish
Dawlish[23] | Party | Candidate | Votes | % |
| | Conservative | John Clatworthy | 1,579 | 43.8 |
| | UKIP | Martin Heath | 1,094 | 30.4 |
| | Labour | Bernard Mills | 371 | 10.3 |
| | Liberal Democrats | Mike James | 294 | 8.2 |
| | Green | Gilly Robinson | 259 | 7.2 |
| Majority | 485 | 13.5 |
| Turnout | 3,602 | 32.4 |
| | Conservative hold |
Duryard and Pennsylvania
Duryard and Pennsylvania[24] | Party | Candidate | Votes | % |
| | Conservative | Percy Prowse | 1,057 | 42.8 |
| | Labour | Hannah Packham | 541 | 21.9 |
| | UKIP | Colin Stewart | 361 | 14.6 |
| | Liberal Democrats | Kevin Martin Chun | 288 | 11.7 |
| | Green | Chris Barnett | 216 | 8.7 |
| Majority | 516 | 20.9 |
| Turnout | 2,469 | 26.8 |
| | Conservative hold |
Exminster and Kenton
Exminster and Kenton[25] | Party | Candidate | Votes | % |
| | Liberal Democrats | Alan Michael Connett | 1,508 | 49.3 |
| | Conservative | Kevin Andrew Lake | 930 | 30.4 |
| | UKIP | Elizabeth Mary Burton | 355 | 11.6 |
| | Green | Andy Bragg | 150 | 4.9 |
| | Labour | Paul David Bull | 113 | 3.7 |
| Majority | 578 | 18.9 |
| Turnout | 3,061 | 41.6 |
| | Liberal Democrats hold |
Exmouth Brixington and Withycombe
Exmouth Brixington and Withycombe[26] | Party | Candidate | Votes | % |
| | UKIP | John A Hone | 926 | 33.3 |
| | Liberal Democrats | Brenda O Taylor | 742 | 26.7 |
| | Conservative | Jill Elson | 690 | 24.8 |
| | Labour | Stuart Fegan | 280 | 10.1 |
| | Green | Oliver Davey | 138 | 5.0 |
| Majority | 184 | 6.6 |
| Turnout | 2,780 | 27.4 |
| | UKIP gain from Liberal Democrats |
Exmouth Halsdon and Woodbury
Exmouth Halsdon and Woodbury[27] | Party | Candidate | Votes | % |
| | Conservative | Bernard C Hughes | 1,210 | 42.5 |
| | UKIP | Patrick C McAndrew | 707 | 24.9 |
| | Liberal Democrats | Tim Dumper | 642 | 22.6 |
| | Labour | Lesley Johnson | 274 | 9.6 |
| Majority | 503 | 17.7 |
| Turnout | 2,845 | 32.5 |
| | Conservative hold |
Exmouth Littleham and Town
Exmouth Littleham and Town[28] | Party | Candidate | Votes | % |
| | Liberal Democrats | Eileen E Wragg | 1,009 | 31.7 |
| | Conservative | John T Humphreys | 934 | 29.3 |
| | UKIP | Ann Prior | 795 | 24.9 |
| | Labour | Ray Davison | 309 | 9.7 |
| | Green | Ben Jones | 131 | 4.1 |
| Majority | 75 | 2.4 |
| Turnout | 3,187 | 30.7 |
| | Liberal Democrats hold |
Exwick and St. Thomas
Exwick and St. Thomas[29] | Party | Candidate | Votes | % |
| | Labour | Rob Hannaford | 1,593 | 49.9 |
| | UKIP | Brian Jeffery | 755 | 23.6 |
| | Conservative | Lizzie Roberts | 340 | 10.6 |
| | Liberal Democrats | Sally Elizabeth Willcox | 244 | 7.6 |
| | Green | Audaye Khalid Elesedy | 147 | 4.6 |
| | Independent | Lee Matthew Gillett | 110 | 3.4 |
| Majority | 838 | 26.2 |
| Turnout | 3,193 | 27.4 |
| | Labour hold |
Fremington Rural
Fremington Rural[30] | Party | Candidate | Votes | % |
| | Independent | Frank Biederman | 1,526 | 45.6 |
| | Independent | Rodney Sheridan Cann | 904 | 27.0 |
| | UKIP | Caroline Susan Crowther | 514 | 15.4 |
| | Conservative | John Himan | 203 | 6.1 |
| | No label | Joanne Bell | 73 | 2.2 | {{{change}}} |
| | Labour | Danny James Neary | 72 | 2.2 |
| | Green | Liz Wood | 50 | 1.5 |
| Majority | 622 | 18.6 |
| Turnout | 3,346 | 39.0 |
| | Independent gain from Independent |
Hatherleigh and Chagford
Hatherleigh and Chagford[31] | Party | Candidate | Votes | % |
| | Conservative | James Raymond McInnes | 1,981 | 49.9 |
| | UKIP | Alan Gross | 1,195 | 30.1 |
| | Labour | Irene S Wareing | 401 | 10.1 |
| | Green | William Douglas-Mann | 383 | 9.6 |
| Majority | 786 | 19.8 |
| Turnout | 3,969 | 37.3 |
| | Conservative hold |
Heavitree and Whipton Barton
Heavitree and Whipton Barton[32] | Party | Candidate | Votes | % |
| | Labour | Olwen Foggin | 1,655 | 48.1 |
| | Conservative | Peter Geoffrey Holland | 803 | 23.3 |
| | UKIP | Richard Timmis | 605 | 17.6 |
| | Liberal Democrats | Ditch Townsend | 190 | 5.5 |
| | Green | Rouben Scott Freeman | 186 | 5.4 |
| Majority | 852 | 24.7 |
| Turnout | 3,444 | 33.6 |
| | Labour hold |
Holsworthy Rural
Holsworthy Rural[33] | Party | Candidate | Votes | % |
| | Conservative | Barry Parsons | 1,912 | 47.0 |
| | UKIP | Penny Mills | 1,548 | 38.0 |
| | Green | Keith Stuart Funnell | 203 | 5.0 |
| | Independent | Sandra Louise Willetts | 201 | 4.9 |
| | Labour | Viv Gale | 197 | 4.8 |
| Majority | 364 | 8.9 |
| Turnout | 4,069 | 38.7 |
| | Conservative hold |
Honiton St. Michael's
Honiton St. Michael's[34] | Party | Candidate | Votes | % |
| | Conservative | Sara M Randall Johnson | 1,034 | 35.9 |
| | UKIP | Brian J Smith | 798 | 27.7 |
| | Green | Sharon D Pavey | 709 | 24.6 |
| | Labour | Michael J Teare | 181 | 6.3 |
| | Liberal Democrats | Jonathan W Underwood | 159 | 5.5 |
| Majority | 236 | 8.2 |
| Turnout | 2,883 | 32.4 |
| | Conservative hold |
Honiton St. Paul's
Honiton St. Paul's[35] | Party | Candidate | Votes | % |
| | Conservative | Paul A Diviani | 1,130 | 38.3 |
| | UKIP | Peter C Townsend | 790 | 26.8 |
| | Independent | Cathy Gardner | 352 | 11.9 |
| | Labour | Sally Broom | 317 | 10.7 |
| | Liberal Democrats | Paul Newman | 176 | 6.0 |
| | Green | Martin R Paine | 169 | 5.7 |
| Majority | 340 | 11.5 |
| Turnout | 2,953 | 32.5 |
| | Conservative hold |
Ilfracombe
Ilfracombe[36] | Party | Candidate | Votes | % |
| | Independent | Mike Edmunds | 851 | 36.4 |
| | Conservative | Paul Edwards Crabb | 747 | 31.9 |
| | UKIP | Alan Roy Whittle | 482 | 20.6 |
| | Labour | Marianna Holdsworth | 253 | 10.8 |
| Majority | 104 | 4.4 |
| Turnout | 2,339 | 25.2 |
| | Independent gain from Liberal Democrats |
Ivybridge
Ivybridge[37] | Party | Candidate | Votes | % |
| | Conservative | Roger Frederick Croad | 1,028 | 40.6 |
| | UKIP | Edward James Lally | 714 | 28.2 |
| | Green | Katie Anne Reville | 601 | 23.7 |
| | Liberal Democrats | Jon May | 185 | 7.3 |
| Majority | 314 | 12.4 |
| Turnout | 2,534 | 27.1 |
| | Conservative hold |
Kingsbridge and Stokenham
Kingsbridge and Stokenham[38] | Party | Candidate | Votes | % |
| | Liberal Democrats | Julian Charles Brazil | 1,418 | 40.4 |
| | Conservative | Keith Robert Henry Wingate | 1,153 | 32.8 |
| | UKIP | Joshua John Alexander Gardner | 772 | 22.0 |
| | Labour | Louise Lewis | 159 | 4.5 |
| Majority | 265 | 7.5 |
| Turnout | 3,513 | 42.9 |
| | Liberal Democrats hold |
Kingsteignton
Kingsteignton[39] | Party | Candidate | Votes | % |
| | UKIP | Tony Dempster | 908 | 36.5 |
| | Conservative | Mike Walters | 753 | 30.2 |
| | Liberal Democrats | Michael John Hocking | 458 | 18.4 |
| | Labour | Robert Alexander Kennedy | 286 | 11.5 |
| | Green | David Philip Bailey | 78 | 3.1 |
| Majority | 155 | 6.2 |
| Turnout | 2,490 | 27.5 |
| | UKIP gain from Conservative |
Newton Abbot North
Newton Abbot North[40] | Party | Candidate | Votes | % |
| | Conservative | Eve Louise Barisic | 700 | 28.3 |
| | Liberal Democrats | Jackie Brodie | 620 | 25.1 |
| | UKIP | Will Forrow | 500 | 20.2 |
| | Independent | Anne Fry | 347 | 14.0 |
| | Labour | Mary Brenda Kennedy | 211 | 8.5 |
| | Green | Julie Anne Boultby | 87 | 3.5 |
| Majority | 80 | 3.2 |
| Turnout | 2,472 | 25.9 |
| | Conservative gain from Liberal Democrats |
Newton Abbot South
Newton Abbot South[41] | Party | Candidate | Votes | % |
| | Liberal Democrats | Gordon Nicholas Hook | 1,450 | 47.4 |
| | Conservative | John Gadie | 669 | 21.8 |
| | UKIP | Rod Peers | 662 | 21.6 |
| | Labour | Paula Joan Black | 268 | 8.8 |
| Majority | 781 | 25.5 |
| Turnout | 3,062 | 30.8 |
| | Liberal Democrats hold |
Newton St. Cyres and Sandford
Newton St. Cyres and Sandford[42] | Party | Candidate | Votes | % |
| | Conservative | Margaret Edith Squires | 1,735 | 46.4 |
| | UKIP | Bob Edwards | 855 | 22.9 |
| | Labour | Charlie Werner | 591 | 15.8 |
| | Liberal Democrats | John Downes | 308 | 8.2 |
| | Green | Keith Povey | 246 | 6.6 |
| Majority | 880 | 23.5 |
| Turnout | 3,741 | 40.1 |
| | Conservative hold |
Newtown and Polsloe
Newtown and Polsloe[43] | Party | Candidate | Votes | % |
| | Labour | Richard Westlake | 1,314 | 56.5 |
| | Conservative | Rob Newby | 363 | 15.6 |
| | UKIP | Jacqueline Holdstock | 297 | 12.8 |
| | Green | Tom Milburn | 210 | 9.0 |
| | Liberal Democrats | Alan Williamson | 106 | 4.6 |
| | TUSC | Carlos Hudson | 29 | 1.2 |
| Majority | 951 | 40.9 |
| Turnout | 2,324 | 29.1 |
| | Labour hold |
Northam
Northam[44] | Party | Candidate | Votes | % |
| | Conservative | Andrew John Eastman | 1,616 | 40.5 |
| | UKIP | Chris Leather | 1,475 | 36.9 |
| | Green | Peter Graham Hames | 329 | 8.2 |
| | Labour | James Andrew Craigie | 303 | 7.6 |
| | Liberal Democrats | David Berryman | 258 | 6.5 |
| Majority | 141 | 3.5 |
| Turnout | 3,992 | 39.4 |
| | Conservative hold |
Okehampton Rural
Okehampton Rural[45] | Party | Candidate | Votes | % |
| | Conservative | Kevin Ball | 1,477 | 40.9 |
| | UKIP | Daniel Pledger | 1,156 | 32.0 |
| | Labour | Terry Cummings | 520 | 14.4 |
| | Liberal Democrats | Christopher John Bones | 438 | 12.1 |
| Majority | 321 | 8.9 |
| Turnout | 3,607 | 31.8 |
| | Conservative hold |
Ottery St. Mary Rural
Ottery St. Mary Rural[46] | Party | Candidate | Votes | % |
| | Independent | Claire L Wright | 2,970 | 74.1 |
| | Conservative | Chris Wale | 522 | 13.0 |
| | UKIP | John Kelly | 382 | 9.5 |
| | Labour | Andrew V Blackwell | 124 | 3.1 |
| Majority | 2,448 | 61.1 |
| Turnout | 4,007 | 43.4 |
| | Independent hold |
Pinhoe and Mincinglake
Pinhoe and Mincinglake[47] | Party | Candidate | Votes | % |
| | Labour | Emma Morse | 1,354 | 43.1 |
| | UKIP | Keith Crawford | 809 | 25.7 |
| | Conservative | Cynthia Thompson | 782 | 24.9 |
| | Liberal Democrats | John Robert Orm Ashton | 97 | 3.1 |
| | Green | Isaac Micah Euan Price-Sosner | 92 | 2.9 |
| Majority | 545 | 17.3 |
| Turnout | 3,142 | 34.1 |
| | Labour hold |
Priory and St. Leonard's
Priory and St. Leonard's[48] | Party | Candidate | Votes | % |
| | Labour | Andy Hannan | 1,711 | 44.1 |
| | Conservative | Stephanie Warner | 1,129 | 29.1 |
| | UKIP | Jacalyn Warwick | 481 | 12.4 |
| | Green | Alison Harcourt | 243 | 6.3 |
| | Liberal Democrats | Joel Mason | 143 | 3.7 |
| | Your Decision To Keep Lights On | Nicola Guagliardo | 133 | 3.4 | {{{change}}} |
| | BNP | Christopher Stone | 28 | 0.7 |
| Majority | 582 | 15.0 |
| Turnout | 3,879 | 35.7 |
| | Labour hold |
Seaton Coastal
Seaton Coastal[49] | Party | Candidate | Votes | % |
| | Conservative | Jim Knight | 1,312 | 38.8 |
| | UKIP | Warwick J Knowles | 956 | 28.3 |
| | Liberal Democrats | Peter W Burrows | 713 | 21.1 |
| | Labour | Stephen R Williams | 372 | 11.0 |
| Majority | 356 | 10.5 |
| Turnout | 3,379 | 35.4 |
| | Labour hold |
Sidmouth Sidford
Sidmouth Sidford[50] | Party | Candidate | Votes | % |
| | Conservative | Stuart Hughes | 1,923 | 47.2 |
| | UKIP | Lawrie Brownlee | 1,505 | 36.9 |
| | Labour | Judy Blackwell | 361 | 8.9 |
| | Liberal Democrats | Martin Gammell | 278 | 6.8 |
| Majority | 418 | 10.3 |
| Turnout | 4,078 | 37.5 |
| | Conservative hold |
South Brent and Dartington
South Brent and Dartington[51] | Party | Candidate | Votes | % |
| | Conservative | Rosemary Rowe | 1,114 | 34.1 |
| | Green | Jacqi Hodgson | 940 | 28.8 |
| | UKIP | Ray Harrington | 594 | 18.2 |
| | Labour | Tony Whitty | 375 | 11.5 |
| | Liberal Democrats | David Allan Robinson | 238 | 7.3 |
| Majority | 174 | 5.3 |
| Turnout | 3,267 | 36.7 |
| | Conservative hold |
South Molton
South Molton Rural[52] | Party | Candidate | Votes | % |
| | Conservative | Jeremy Owen Yabsley | 1,419 | 42.8 |
| | Liberal Democrats | Matthew Thomas Bushell | 933 | 28.2 |
| | UKIP | Brian David Hockin | 696 | 21.0 |
| | Labour | Hilary Kathryn Greenfield | 167 | 5.0 |
| | Green | L'Anne Knight | 90 | 2.7 |
| Majority | 486 | 14.7 |
| Turnout | 3,314 | 34.9 |
| | Conservative hold |
St. Davids and St. James
St. Davids and St. James[53] | Party | Candidate | Votes | % |
| | Labour | Jill Owen | 732 | 34.3 |
| | Liberal Democrats | Philip John Brock | 671 | 31.4 |
| | Green | Andrew Wallace Bell | 294 | 13.8 |
| | UKIP | Ralph Gay | 207 | 9.7 |
| | Conservative | James Roberts | 188 | 8.8 |
| | TUSC | Luke Christopher Pilling | 34 | 1.6 |
| Majority | 61 | 2.9 |
| Turnout | 2,136 | 22.5 |
| | Labour gain from Liberal Democrats |
St. Loyes and Topsham
St. Loyes and Topsham[54] | Party | Candidate | Votes | % |
| | Conservative | Andrew Robert Leadbetter | 1,487 | 49.8 |
| | Labour | Elliot Wright | 731 | 24.5 |
| | UKIP | Valerie Angus | 482 | 16.2 |
| | Green | Mark Stephen Cox | 144 | 4.8 |
| | Liberal Democrats | Christine Vince | 133 | 4.5 |
| Majority | 756 | 25.3 |
| Turnout | 2,983 | 31.0 |
| | Conservative hold |
Tavistock
Tavistock[55] | Party | Candidate | Votes | % |
| | Conservative | Debo Sellis | 1,544 | 40.7 |
| | UKIP | George Edward Mudge | 804 | 21.2 |
| | Liberal Democrats | Alison Clish-Green | 795 | 20.9 |
| | Labour | Moira Brown | 392 | 10.3 |
| | Green | Judy Sara Maciejowska | 249 | 6.6 |
| Majority | 740 | 19.5 |
| Turnout | 3,796 | 34.1 |
| | Conservative hold |
Teign Estuary
Teign Estuary[56] | Party | Candidate | Votes | % |
| | Conservative | Christopher Stuart Clarance | 1,178 | 37.2 |
| | Liberal Democrats | David Nicholas Cox | 1,121 | 35.4 |
| | UKIP | Richard Stanton | 613 | 19.4 |
| | Labour | Anthony Ronald Randall | 252 | 8.0 |
| Majority | 57 | 1.8 |
| Turnout | 3,166 | 35.9 |
| | Conservative hold |
Teignbridge South
Teignbridge South[57] | Party | Candidate | Votes | % |
| | Liberal Democrats | Alistair Dewhirst | 1,396 | 41.3 |
| | Conservative | Dennis Esmond Smith | 1,001 | 29.6 |
| | UKIP | Sue Doidge | 683 | 20.2 |
| | Labour | Jacqueline Anne Stewart | 161 | 4.8 |
| | Green | Keith Clements | 139 | 4.1 |
| Majority | 395 | 11.7 |
| Turnout | 3,383 | 37.1 |
| | Liberal Democrats gain from Conservative |
Teignmouth
Teignmouth[58] | Party | Candidate | Votes | % |
| | Liberal Democrats | Richard Younger-Ross | 1,185 | 37.2 |
| | Conservative | James Robert McMurray | 913 | 28.7 |
| | UKIP | Mike Smith | 749 | 23.5 |
| | Labour | Niall Thomas Duffy | 248 | 7.8 |
| | TUSC | Sean Brogan | 78 | 2.5 |
| Majority | 272 | 8.5 |
| Turnout | 3,182 | 39.4 |
| | Liberal Democrats gain from Conservative |
Thurlestone, Salcombe and Allington
Thurlestone, Salcombe and Allington[59] | Party | Candidate | Votes | % |
| | Conservative | Rufus Gilbert | 1,447 | 47.8 |
| | UKIP | Dennis Hobday | 1,009 | 33.3 |
| | Labour | Michael Connelly | 196 | 6.5 |
| | Liberal Democrats | Laurel Lawford | 195 | 6.4 |
| | Green | Daniel Forster | 174 | 5.7 |
| Majority | 438 | 14.5 |
| Turnout | 3,028 | 38.9 |
| | Conservative hold |
Tiverton East
Tiverton East[60] | Party | Candidate | Votes | % |
| | Liberal Democrats | Des Hannon | 1,093 | 37.4 |
| | Conservative | Neal Vincent Davey | 726 | 24.8 |
| | UKIP | George Birch | 644 | 22.0 |
| | Labour | Christopher James Chesney | 272 | 9.3 |
| | Green | Robert Harper Rickey | 138 | 4.7 |
| | TUSC | Steve Bush | 47 | 1.6 |
| Majority | 367 | 12.5 |
| Turnout | 2,926 | 28.7 |
| | Liberal Democrats hold |
Tiverton West
Tiverton West[61] | Party | Candidate | Votes | % |
| | Conservative | Polly Colthorpe | 1,032 | 35.4 |
| | UKIP | Tony McIntyre | 798 | 27.4 |
| | Labour | Anne Kilshaw | 366 | 12.6 |
| | Liberal Democrats | Henry George Edwin Oliver | 263 | 9.0 |
| | Independent | Steve Flaws | 188 | 6.5 |
| | Independent | Clive McIntyre | 139 | 4.8 |
| | Green | Catherine Povey | 120 | 4.1 |
| Majority | 234 | 8.0 |
| Turnout | 2,913 | 29.5 |
| | Conservative hold |
Torrington Rural
Torrington Rural[62] | Party | Candidate | Votes | % |
| | Conservative | Andy Boyd | 1,284 | 38.4 |
| | UKIP | James Conabere | 955 | 28.6 |
| | Liberal Democrats | Adrian Stuart Freeland | 531 | 15.9 |
| | Green | Catherine Hannah Simmons | 299 | 8.9 |
| | Labour | Gillian Tesh | 264 | 7.9 |
| Majority | 329 | 9.8 |
| Turnout | 3,341 | 31.1 |
| | Conservative hold |
Totnes Rural
Totnes Rural[63] | Party | Candidate | Votes | % |
| | Green | Robert Vint | 984 | 31.9 |
| | Conservative | Colin Edward Hair | 761 | 24.7 |
| | Labour | Carole Whitty | 581 | 18.9 |
| | UKIP | Ian Campbell Keir | 462 | 15.0 |
| | Liberal Democrats | Andrew Bridgwater | 290 | 9.4 |
| Majority | 223 | 7.2 |
| Turnout | 3,082 | 35.8 |
| | Green hold |
Willand and Uffculme
Willand and Uffculme[64] | Party | Candidate | Votes | % |
| | Conservative | Ray Radford | 1,243 | 39.1 |
| | UKIP | David Ewart Graham | 759 | 23.9 |
| | Independent | David Follett Pugsley | 499 | 15.7 |
| | Labour | Jocelyn Anne Pritchard | 325 | 10.2 |
| | Liberal Democrats | Richard John Foord | 172 | 5.4 |
| | Green | Hugh Meller | 168 | 5.3 |
| Majority | 484 | 15.2 |
| Turnout | 3,175 | 30.7 |
| | Conservative hold |
Yealmpton
Yealmpton[65] | Party | Candidate | Votes | % |
| | Conservative | Will Mumford | 1,655 | 51.1 |
| | UKIP | Stuart Edward Munnery | 611 | 18.9 |
| | Liberal Democrats | Brian Samuel Blake | 574 | 17.7 |
| | Green | Janet Elsie Chapman | 388 | 12.0 |
| Majority | 1,044 | 32.2 |
| Turnout | 3,240 | 35.8 |
| | Conservative hold |
Yelverton Rural
Yelverton Rural[66] | Party | Candidate | Votes | % |
| | Conservative | Philip Richard Sanders | 1,291 | 37.6 |
| | UKIP | Andrew George James Mudge | 963 | 28.0 |
| | Liberal Democrats | Gail Bones | 518 | 15.1 |
| | Labour | Samantha Louise Loveridge | 374 | 10.9 |
| | Green | Lynton Jon Wells North | 283 | 8.2 |
| Majority | 328 | 9.5 |
| Turnout | 3,436 | 33.5 |
| | Conservative hold |
References


 6.6
6.6  7.1
7.1  Council elections in Devon


