Countries by soybean production in 2020 This is a list of countries by soybean production from 2016 to 2020, based on data from the Food and Agriculture Organization Corporate Statistical Database .[1] [n 1]
Production by country >1,000,000 tonnes Rank Country 2020 2019 2018 2017 2016 1 121,797,712 114,316,829 117,912,450 114,732,101 96,394,820 2 112,549,240 96,667,090 120,514,490 120,064,970 116,931,500 3 48,796,661 55,263,891 37,787,927 54,971,626 58,799,258 4 19,600,000 18,100,000 15,967,100 15,282,500 12,788,894 5 11,226,000 13,267,520 10,932,970 13,158,730 13,159,000 6 11,024,460 8,520,350 11,045,971 10,478,000 9,163,030 7 6,358,500 6,145,000 7,416,600 7,716,600 6,596,500 8 4,307,593 4,359,956 4,026,850 3,621,712 3,142,693 9 2,829,356 2,990,845 2,942,131 2,671,046 3,203,992 10 2,797,670 3,698,710 4,460,770 3,899,370 4,276,990 11 1,990,000 2,828,000 1,334,000 3,212,000 2,208,000 12 1,245,500 1,170,345 1,540,000 1,316,000 742,000 13 1,040,000 980,000 953,571 538,729 859,653 14 1,005,630 1,042,830 1,186,350 1,019,781 1,081,340
100,000–1,000,000 tonnes Rank Country 2020 2019 2018 2017 2016 15 751,578 700,502 645,607 461,272 576,446 16 600,000 700,000 660,000 993,955 936,887 17 406,670 428,530 398,480 415,202 338,955 18 Romania 353,640 440,120 492,680 393,495 263,380 19 Zambia 296,866 281,389 302,720 351,416 267,490 20 Croatia 266,010 244,280 245,190 207,765 244,075 21 Kazakhstan 260,639 282,185 255,437 252,319 231,168 22 Benin 253,954 257,000 221,977 164,761 156,901 23 Mexico 246,019 232,680 324,011 432,927 509,114 24 North Korea 229,892 263,920 135,280 223,325 282,000 25 Japan 218,900 217,800 211,300 253,000 238,000 26 Ethiopia 208,676 125,623 149,455 86,468 81,235 27 Austria 204,860 217,780 186,490 193,416 152,599 28 Cambodia 180,000 168,000 170,000 168,000 162,000 28 Malawi 180,000 170,000 175,475 208,556 132,417 30 Ghana 177,007 184,653 176,700 170,490 143,220 31 Hungary 165,760 169,570 181,240 179,282 184,725 32 Turkey 155,225 150,000 140,000 140,000 165,000 33 Myanmar 145,000 141,939 143,717 145,465 149,185 34 Iran 140,000 150,000 140,000 130,000 139,325 35 Slovakia 132,200 119,660 106,960 102,441 92,484 36 Colombia 119,412 114,056 92,231 80,106 80,548 37 Bangladesh 104,761 110,785 98,699 96,921 92,181
10,000–100,000 tonnes Rank Country 2020 2019 2018 2017 2016 38 Germany 90,500 84,100 58,700 66,000 43,000 39 South Korea 80,926 105,340 89,410 85,644 75,448 40 Uganda 75,077 117,000 107,624 28,097 25,730 41 Mozambique 75,000 55,000 55,000 50,000 47,000 42 Vietnam 65,405 77,263 81,348 101,856 160,696 43 Zimbabwe 59,656 23,460 69,688 36,478 47,755 44 Egypt 50,000 36,260 46,997 36,388 45,165 45 Burkina Faso 48,000 51,708 31,314 18,500 25,851 46 Guatemala 41,000 39,000 38,000 38,000 38,000 47 Angola 40,797 37,350 35,266 36,001 15,740 48 Nepal 37,526 31,567 27,681 29,061 28,917 49 Bosnia and Herzegovina 37,202 23,753 23,332 11,740 18,662 50 Moldova 33,360 64,239 57,684 46,524 42,125 51 Czech Republic 33,020 27,840 25,260 37,012 27,972 52 Thailand 29,231 26,283 41,165 42,829 37,765 53 Ecuador 27,238 39,515 25,504 35,006 41,788 54 Democratic Republic of the Congo 26,000 25,044 24,427 22,150 24,000 55 Cameroon 24,195 23,054 21,270 26,429 24,558 56 Tanzania 23,886 22,953 21,321 6,135 6,711 57 Rwanda 23,755 24,526 22,809 23,934 21,942 58 Australia 17,323 15,136 28,903 31,335 29,403 59 Poland 14,940 15,540 10,390 20,297 14,747 60 Mali 14,685 10,440 6,693 5,801 11,769 61 Laos 14,550 11,873 8,380 7,960 19,130 62 Belize 13,670 7,819 11,776 13,037 7,779 63 Nicaragua 10,000 10,000 5,693 5,693 5,693
<10,000 tonnes Rank Country 2020 2019 2018 2017 2016 64 Venezuela 9,306 22,242 5,407 7,855 1,720 65 Sri Lanka 7,879 2,197 2,500 14,363 9,830 66 Uzbekistan 7,460 10,858 11,399 6,138 232 67 Syria 6,227 2,086 1,727 3,901 3,550 68 Bulgaria 6,200 7,570 4,730 20,000 18,301 69 Switzerland 5,247 5,350 3,740 5,642 4,500 70 El Salvador 5,084 5,076 5,107 5,069 5,052 71 Slovenia 5,020 4,240 5,330 7,713 7,387 72 Spain 4,620 5,170 4,350 4,599 2,869 73 Taiwan 4,447 4,776 4,404 4,674 3,061 74 Gabon 4,203 4,148 4,094 4,047 3,857 75 Liberia 3,417 3,392 3,367 3,346 3,157 76 Burundi 2,571 2,606 2,387 2,167 2,395 77 Lithuania 2,560 2,310 3,450 N/A N/A 78 Kenya 2,396 2,396 2,398 2,518 2,007 79 Kyrgyzstan 2,371 2,835 2,872 3,512 1,240 80 2,000 2,000 2,000 2,062 2,052 81 Greece 1,840 3,720 2,520 8,099 9,465 82 Togo 1,796 1,775 1,828 1,784 1,713 83 Peru 1,538 1,475 1,530 1,581 1,371 84 Honduras 1,444 1,455 2,180 2,210 2,200 85 East Timor 978 977 975 965 968 86 Morocco 727 727 699 756 1,000 87 Philippines 554 659 658 666 544 88 Albania 441 605 744 500 664 89 Ivory Coast 401 401 371 581 700 90 Bhutan 234 171 107 204 254 91 Pakistan 152 15 28 19 40 92 Panama 100 100 99 100 101 93 Madagascar 46 46 46 47 46 94 Iraq 33 33 35 32 31 95 Luxembourg 30 N/A N/A N/A N/A 96 Azerbaijan 29 30 29 29 33 97 Tajikistan 21 21 21 21 21 98 North Macedonia 18 18 85 34 1 99 Suriname 12 11 7 7 7
Production by country per capita Here's the top 10 country with the highest production of soybean per capita .[2]
Notes ^ Sum of values for countries with available data, which may be official or FAO data based on imputation methodology References ^ "Crops". FAOSTAT . Retrieved 11 June 2022 . ^ World Soybean Production by Country 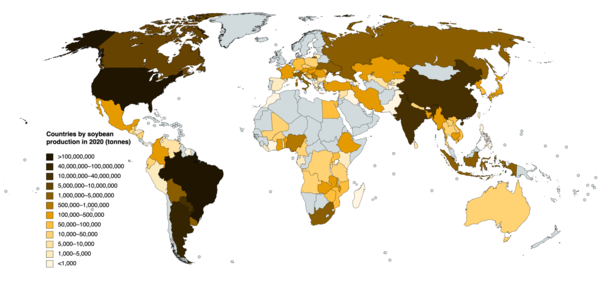
 Brazil
 United States
 Argentina
 China
China India
India Paraguay
 Canada
 Russia
 Bolivia
 Ukraine
 Uruguay
 South Africa
 Indonesia
 Italy
Italy Serbia
 Nigeria
 France
 Romania
 Zambia
 Croatia
 Kazakhstan
 Benin
Benin Mexico
 North Korea
 Japan
Japan Ethiopia
 Austria
 Cambodia
 Malawi
 Ghana
Ghana Hungary
 Turkey
 Myanmar
 Iran
Iran Slovakia
 Colombia
 Bangladesh
 Germany
 South Korea
 Uganda
 Mozambique
 Vietnam
 Zimbabwe
 Egypt
Egypt Burkina Faso
 Guatemala
 Angola
 Nepal
Nepal Bosnia and Herzegovina
 Moldova
 Czech Republic
 Thailand
 Ecuador
 Democratic Republic of the Congo
 Cameroon
 Tanzania
 Rwanda
 Australia
 Poland
 Mali
Mali Laos
Laos Belize
 Nicaragua
 Venezuela
 Sri Lanka
 Uzbekistan
 Syria
Syria Bulgaria
 Switzerland
 El Salvador
 Slovenia
 Spain
Spain Taiwan
 Gabon
Gabon Liberia
 Burundi
 Lithuania
 Kenya
Kenya Kyrgyzstan
 Georgia
 Greece
 Togo
Togo Peru
Peru Honduras
 East Timor
 Morocco
 Philippines
 Ivory Coast
 Bhutan
 Pakistan
 Panama
 Madagascar
 Iraq
Iraq Luxembourg
 Azerbaijan
 Tajikistan
 North Macedonia
 Suriname


